Free tool · no sign-up

A/B test sample size calculator

Before you start a test, know how many visitors it needs and how long that takes. Enter your baseline conversion rate and the smallest change worth detecting.

Your A/B test

%

How the control converts today.

Minimum effect as
%

The smallest change worth knowing about: 5.00% → 5.50%.

Confidence
Power

All versions together.

Visitors per version
31,234
About 1,562 conversions in the control.
Visitors in total
62,468
2 versions
Days to run
32
About 4.6 weeks.

Smaller effects cost a lot more traffic

  • 2% lift752,703· 753 d
  • 5% lift122,124· 123 d
  • 10% lift31,234· 32 d
  • 15% lift14,193· 15 d
  • 20% lift8,158· 9 d
  • 30% lift3,780· 4 d
  • 50% lift1,471· 2 d

Visitors per version for each effect size, and days at your traffic. Halving the effect you want to detect roughly quadruples the visitors you need.

How it works

The calculator uses the standard two-sided test for the difference between two proportions. You choose how sure you want to be about a winner (confidence) and how likely you want to be to spot a real effect of the size you care about (power). It returns the visitors each version needs and, from your daily traffic, how many days the test will run.

The trade-off that matters

Sample size grows with the square of how precise you want to be. That is why the panel on the right shows the cost of smaller effects: if a 5% lift would take months, the honest options are to test something bolder, test where traffic is higher, or learn another way.

Good habits

  • Write down the hypothesis and the sample size before you start.
  • Run whole weeks, so weekdays and weekends are both in it.
  • Don’t stop early on a significant peek, and don’t extend a test that didn’t win.
  • Test the riskiest assumption behind an idea, not the idea’s polish.
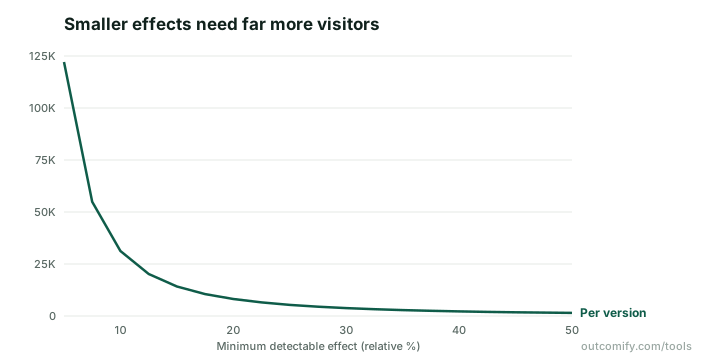
Line chart of visitors needed per version against minimum detectable effect for a 5% baseline conversion rate: about 31,000 for a 10% lift and about 8,000 for 20%.
Visitors per version at 95% confidence and 80% power from a 5% baseline. Halving the effect you want to detect roughly quadruples the traffic.

Outcomify

Test the assumptions behind an idea, before you build it

An A/B test is one way to learn. Outcomify maps the assumptions under each solution on your Opportunity Solution Tree, so you test the riskiest first and keep the evidence next to the decision. Free plan, no credit card.

Frequently asked questions

With the standard formula for comparing two proportions: n = (z₁₋α/₂ × √(2p̄(1−p̄)) + z₁₋β × √(p₁(1−p₁) + p₂(1−p₂)))² ÷ (p₂ − p₁)², where p₁ is the baseline rate, p₂ the rate you want to detect, p̄ their average, α one minus confidence and 1 − β the power. The result is visitors per version.

The smallest change you want the test to reliably catch. A 10% relative MDE on a 5% baseline means detecting a move to 5.5%. Smaller effects need far more traffic: halving the MDE roughly quadruples the sample size.

95% confidence and 80% power are the usual defaults. Confidence controls false positives (calling a winner that isn’t one); power controls false negatives (missing a real effect). Raising either costs traffic.

Each extra version adds another comparison with the control, and with it another chance of a false positive. The calculator splits your false-positive rate across the comparisons (a Bonferroni correction), so each version needs a little more traffic.

Not with a classic fixed-sample test like this one. Checking repeatedly and stopping at the first significant result inflates false positives a lot. Decide the sample size up front, run at least a full week to cover weekday patterns, and then read the result.

Test bigger changes (a larger MDE), test higher in the funnel where there are more people, or use qualitative methods first: customer interviews, fake-door tests or concierge experiments often answer the question without statistics.