Free tool · no sign-up
SaaS growth calculator
Project customers and MRR from your sign-ups, activation and churn. Move the sliders to see what happens, pin a baseline to compare a what-if, and find the lever that moves growth most.
Your sign-ups, activation and churn
0% keeps sign-ups flat. Growing marketing or SEO fits here; viral growth works differently. How to model it
Share of sign-ups who become paying customers.
Share of customers lost each month.
What moves the needle: customers in 24 months if one lever gets 10% better
- 10% more sign-ups+156
- 10% better activation+156
- 10% less churn+72
More sign-ups and better activation add the same, since both bring in the same new customers. Less churn pays off slowly but compounds: the longer the horizon, the more it is worth.
Month-by-month table
| Month | Gained | Lost | Customers | MRR |
|---|---|---|---|---|
| Today | 200 | $9,800 | ||
| 1 | 100 | 8 | 292 | $14,308 |
| 2 | 100 | 12 | 380 | $18,636 |
| 3 | 100 | 15 | 465 | $22,790 |
| 4 | 100 | 19 | 547 | $26,779 |
| 5 | 100 | 22 | 625 | $30,607 |
| 6 | 100 | 25 | 700 | $34,283 |
| 7 | 100 | 28 | 772 | $37,812 |
| 8 | 100 | 31 | 841 | $41,199 |
| 9 | 100 | 34 | 907 | $44,451 |
| 10 | 100 | 36 | 971 | $47,573 |
| 11 | 100 | 39 | 1,032 | $50,570 |
| 12 | 100 | 41 | 1,091 | $53,448 |
| 13 | 100 | 44 | 1,147 | $56,210 |
| 14 | 100 | 46 | 1,201 | $58,861 |
| 15 | 100 | 48 | 1,253 | $61,407 |
| 16 | 100 | 50 | 1,303 | $63,851 |
| 17 | 100 | 52 | 1,351 | $66,197 |
| 18 | 100 | 54 | 1,397 | $68,449 |
| 19 | 100 | 56 | 1,441 | $70,611 |
| 20 | 100 | 58 | 1,483 | $72,686 |
| 21 | 100 | 59 | 1,524 | $74,679 |
| 22 | 100 | 61 | 1,563 | $76,592 |
| 23 | 100 | 63 | 1,601 | $78,428 |
| 24 | 100 | 64 | 1,637 | $80,191 |
How the projection is calculated
The calculator steps forward one month at a time:
- Sign-ups start at your monthly number and grow by your sign-up growth rate each month.
- New customers = sign-ups × activation rate.
- Lost customers = customers at the start of the month × monthly churn.
- Customers at the end of the month = start + new − lost, and MRR = customers × average revenue per customer.
The growth ceiling
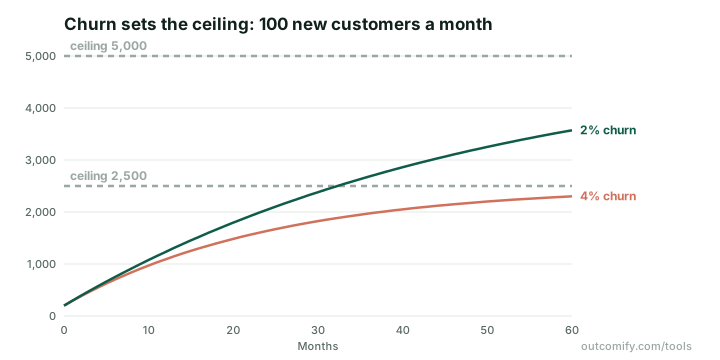
Churn is a share of your base, so it grows as you grow, while flat sign-ups bring the same number of new customers each month. The customer count therefore approaches a ceiling of new customers per month ÷ monthly churn, where the month’s gains and losses cancel out. Spending more on acquisition lifts that ceiling in a straight line; halving churn doubles it.
Reading the levers
The lever panel reruns your projection three times, each with one input 10% better: 10% more sign-ups, a 10% higher activation rate, or 10% less churn. Sign-ups and activation come out equal, because either way you gain the same new customers (unless activation is above about 91%, where it can’t grow a full 10%). Whether that beats churn depends on your horizon and how big your base already is. That is the honest answer to “should we fix onboarding or retention first?”
Where viral growth fits
Sign-up growth per month makes your new sign-ups compound by a fixed percentage, whatever happens to your customer base. That fits growing marketing spend, SEO or a content engine.
Viral growth works differently: your customers bring in new ones, through referrals, invites or word of mouth. So viral sign-ups rise and fall with your customer count, and they stop if your customers leave. Because referrals grow with your base just as churn does, a strong enough loop (each customer bringing in more new customers than churn takes away) removes the growth ceiling altogether.
To approximate a referral loop here, add the sign-ups your current customers bring in today to New sign-ups per month (customers × referral sign-ups per customer per month), and set Sign-up growth per month to roughly how fast your customer base grows. Rerun it as your customer count changes.
What the model leaves out
It is a simple cohort-free model: every customer churns at the same rate, whatever their age, and revenue per customer stays flat. Real churn is usually higher in the first months and lower after, and expansion revenue can make net revenue churn negative. Use it to compare scenarios and find your biggest lever, not as a forecast to the dollar.
Free in Outcomify
Track the funnel behind your activation rate
Activation is usually the cheapest lever to pull. Outcomify’s free key funnels show where new sign-ups drop off before they become customers, and whether what you shipped moved the step. No SDK, no cookies.