Free tool · no sign-up

A/B test significance calculator

Enter visitors and conversions for both versions. Get the uplift, the p-value, a confidence interval for the difference, the chance that B really beats A, and a verdict in plain words.

Your A/B test results

A · control
B · variant
Confidence

B wins. The difference is statistically significant at 95% confidence.

If A and B really converted the same, a gap this big would show up by chance only 4.7% of the time, less than the 5% your confidence level allows.

A converts
5.00%
250 of 5,000
B converts
5.90%
295 of 5,000
Uplift
+18.0%
+0.90 percentage points
p-value
0.0474
Chance B is better: 98%

95% confidence interval for B − A

The true difference is likely between +0.01 and +1.79 percentage points. The interval doesn’t include zero.

How the verdict is reached

  • Conversion rates: conversions ÷ visitors for each version.
  • Uplift: (B − A) ÷ A.
  • p-value: from a two-sided z-test on B − A, with the unpooled standard error of the difference.
  • Confidence interval: B − A ± z × the unpooled standard error of the difference.

Significant isn’t the same as important

With enough traffic, a 0.1-point difference becomes significant and still not worth shipping. Look at the low end of the interval: if the smallest plausible gain is too small to matter, treat the result as a draw.

When to distrust a result

  • Fewer than about 30 conversions in either version.
  • The test was stopped the moment it turned significant.
  • Many metrics or segments were checked and one came out significant.
  • Traffic between versions is far from the split you set (a sample ratio mismatch).
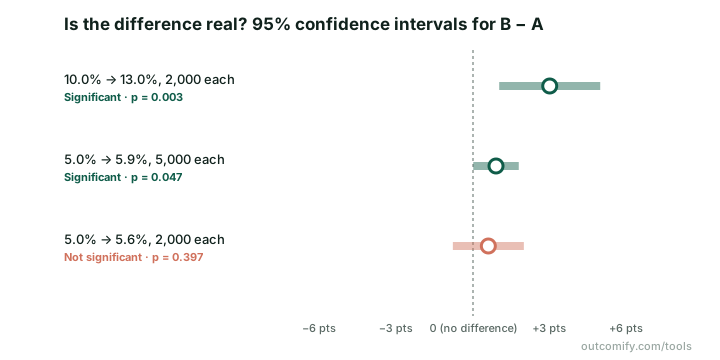
Three 95% confidence intervals for the difference between B and A: one well clear of zero (p = 0.003), one that only just clears zero (p = 0.047), and one that crosses zero and is not significant (p = 0.397).
Three results at 95% confidence. An interval that stays clear of zero is significant: the top one comfortably, the middle one only just. The bottom one could still be no difference at all.

Outcomify

Keep the evidence next to the decision it informed

Outcomify connects each experiment to the assumption it tested and the solution it was for, on your Opportunity Solution Tree, so the team remembers why you built what you built. Free plan, no credit card.

Frequently asked questions

Compare the p-value with your chosen threshold. At 95% confidence, a result is significant when the p-value is below 0.05: if A and B truly converted the same, a gap at least this big would appear by chance less than 5% of the time.

A two-sided two-proportion z-test. The p-value and the confidence interval use the same (unpooled) standard error of the difference, so a significant result always has an interval that leaves out zero, and the other way round. It is the standard test for conversion rates with reasonably large samples.

The range the true difference likely falls in. If it runs from +0.2 to +5.8 percentage points, B is probably better, but the gain could be tiny. An interval that crosses zero means “no difference” is still plausible.

An approximate probability that B’s true conversion rate is higher than A’s, from the normal approximation of the difference. It is easier to explain than a p-value, but use it alongside the interval, not instead of it.

Better not. Early results swing a lot, and peeking until something is significant inflates false positives. Decide the sample size in advance with a sample size calculator and run whole weeks.

No. The calculation runs in your browser and the numbers stay in the page address. Nothing is sent anywhere.