Free tool · no sign-up

NPS calculator

Most NPS calculators stop at the score. This one gives its margin of error too, and tells you whether the change since your last survey is real or just noise.

Your NPS survey responses

Enter
Net Promoter Score
+35
From 100 responses.
Margin of error (95%)
± 14.8
The true score is likely between +20 and +50.
Responses for ± 5 points
873
Needed for this mix of answers.

Promoters, passives and detractors

Detractors 17%Passives 31%Promoters 52%

How the score is calculated

Group the answers: promoters 9–10, passives 7–8, detractors 0–6. NPS is the share of promoters minus the share of detractors, on a scale from −100 to +100. Passives count towards the total but neither add nor subtract.

Why a margin of error matters

NPS throws away detail by collapsing eleven answers into three groups, and that makes it noisy. A move from 32 to 38 on 150 responses is well within the noise, yet it often gets reported as progress. This calculator gives the margin of error for every score and tests any change against it, so you know when to celebrate and when to keep listening.

The score is the start

The number says how customers feel, not why. The follow-up question, “What is the main reason for your score?”, holds the needs and problems worth acting on. Group those answers into themes and count them, and you know what to fix first.
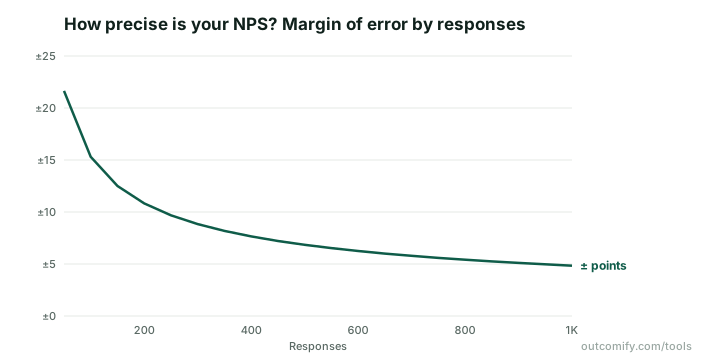
Line chart of the 95% margin of error of an NPS score against number of responses, for 50% promoters and 20% detractors: about ±15 points at 100 responses and ±5 at 900.
Margin of error of an NPS of +30 (50% promoters, 20% detractors) by number of responses. Halving it takes four times the answers.

Free in Outcomify

Find out why they gave that score

Send a short survey to your customers for free. Outcomify turns the open answers into customer needs with counts and quotes, and splits the closed answers by your list’s columns.

Frequently asked questions

Ask “How likely are you to recommend us to a friend or colleague?” on a 0–10 scale. Promoters answer 9–10, passives 7–8 and detractors 0–6. NPS = % promoters − % detractors, so it runs from −100 to +100.

Each answer counts as +1 (promoter), 0 (passive) or −1 (detractor), so NPS is an average with a standard error of √((%P + %D − NPS²) ÷ n). The 95% margin of error is 1.96 × that. With 100 responses it is typically ±15 points or more.

Compare the change with its own margin of error: 1.96 × √(SE₁² + SE₂²). Turn on “Compare with an earlier survey” and the calculator tells you whether the change is larger than that margin, or could be noise.

They use different formulas. This calculator uses the standard normal approximation, 1.96 × √((%P + %D − NPS²) ÷ n), which for 50 promoters, 30 passives and 20 detractors gives ±15.3. Some tools report a wider margin for the same answers because they use a more conservative method, and some don’t say which they use. Methods such as the adjusted Wald interval give similar results to this one at typical sample sizes.

Above 0 means more promoters than detractors; above 30 is generally good and above 50 excellent for B2B software. Benchmarks vary by industry, so your own trend over time is the better comparison.

It depends on how split your answers are. For a ±10-point margin you typically need around 250 responses; ±5 points takes four times as many, often 1,000 or more. The calculator shows the number for your own mix.

No. The calculator runs in your browser and your numbers stay in the page address. Nothing is sent anywhere.