Free tool · no sign-up
Funnel conversion calculator
Enter your funnel’s steps and how each converts from the one before. See how many people make it to the end, the step where most leak, and what fixing each step is worth.
Your funnel steps and conversion rates
Have the number of people at each step instead? Switch to Number of people.
Per month, or any period you like.
Revenue or lifetime value per customer. Leave at 0 to skip.
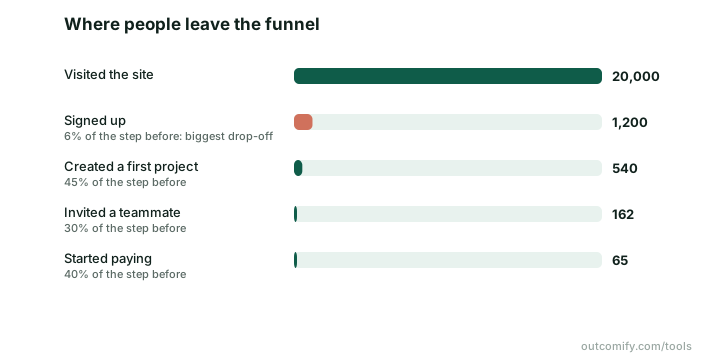
- 01Entry step20,000 people100.0% of entry
- 021,200 people6.0% of entry
- 03540 people2.7% of entry
- 04162 people0.81% of entry
- 0565 people0.32% of entry
What 5 percentage points better on each step is worth at the end
- Signed up (6% → 11%)+54(+83%)
- Created a first project (45% → 50%)+7(+11%)
- Invited a teammate (30% → 35%)+11(+17%)
- Started paying (40% → 45%)+8(+13%)
Every step multiplies the ones after it, so the same few points are worth most where conversion is lowest.
How it’s calculated
People at each step = people at the step before × that step’s conversion rate. Overall conversion is the people at the last step divided by the people who entered. For each step, the calculator also reruns the funnel with that step 5 percentage points better and shows how many more people reach the end.
Why the weakest step matters most
A funnel is a chain of multiplications. Raising a 40% step to 45% grows the end of the funnel by 12.5%; raising a 6% step to 11% grows it by 83%. That is why the biggest leak is highlighted, and why “improve conversion” goals are better aimed at one step than at the whole funnel.
From a model to the real thing
Rates you type in are averages. In a live funnel, the same step can move week to week, by segment and after each release. To know whether a change you shipped moved a step, compare finished weeks before and after, and check the difference is larger than its margin of error.
Free in Outcomify
Track your real funnel, and what moved it
Your backend reports each step, server to server. Outcomify shows conversion, drop-off and time between steps, compares periods with a margin of error, and links each step to the opportunity or solution meant to move it. No SDK, no cookies.